Audio Waveform
Motionbox's music visualizer is one of its top features.
It's not surprising since it can help your audio get more coverage and attention.
But how exactly are music visualizers are created?
In this blog post, we'll give you a technical insight into the audio waveform and how it helps develop our awesome product.
What is an Audio Waveform?
A waveform is an image that represents a sound signal or recording. It Indicates changes in amplitude over a period of time. Signal altitude is measured in the y-axis (vertical), while time is measured on the x-axis (horizontal).
A waveform graph shows the wave change over time. The waveform amplitude controls the high wavelength of the wave.

Most audio recording systems display waveforms to give the user a clear view of what is being recorded. If the waveform was too low and unreported, the recording could have been too soft or quiet. If the waveform almost fills the whole picture, the recording may have been "too hot" or recorded at very high volumes. Changes in the waveform are also good indicators as well as when certain parts of the recording occurred.
For example, the waveform can be small if there is only singing, but it can be very large when the drums and guitar come in. This display enables audio producers to quickly access parts of the song without listening to the recording.
What are the Four Waveforms?
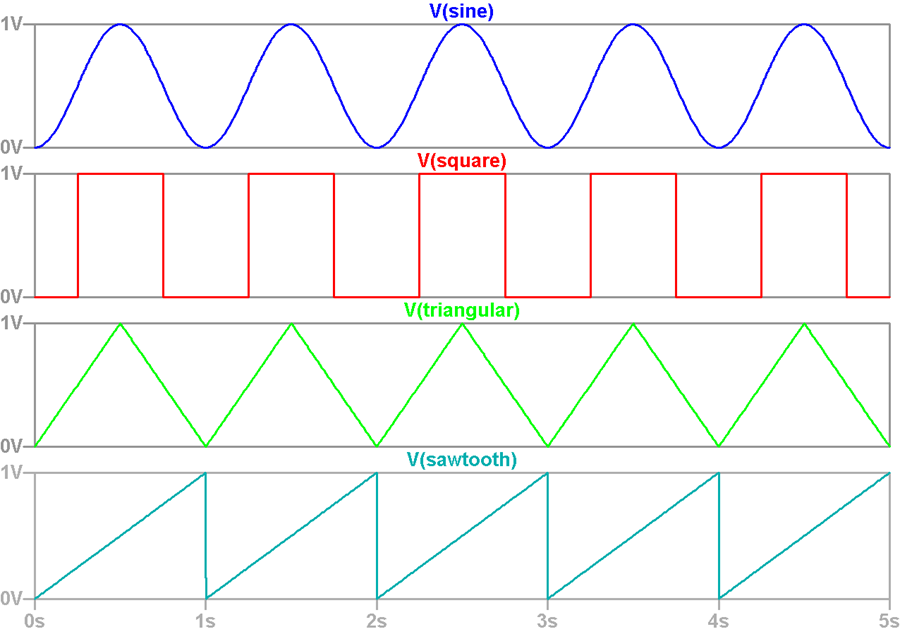
The most common periodic waveforms are the sine, triangle, square, and sawtooth.
Sine Wave
A sine wave is defined as a curve representing periodic oscillations of constant amplitude as given by a sine function.
A sine wave sounds like it looks: smooth and clean. It is sound at its most basic. The sound of a sine wave is only made up of one thing, something known as the fundamental. No partials to be seen.
Try whistling one note or imagine the sound of a tuning fork. All sounds in nature are fundamentally constructed of sine waves. More complex sounds simply contain more oscillations at different frequencies, stacked one upon another.
Square Wave
A waveform shape with squared corners. Unlike the continuous nature of sine waves, square waves have very fast rise and fall times with periods of steady-state voltage at the top and bottom.
There is no way for a theoretically perfect square wave to exist because in practice it always takes some amount of time for the voltage swing from the bottom to the top (and top to bottom) to occur.
A waveform shape does not have to be a perfect geometric square to be considered a square wave, but in general, they do approximate the shape.
A square wave sounds richer and buzzier. In addition to the fundamentals, the square wave also contains harmonics. A harmonic is a kind of partial tone which is a whole multiple of a fundamental frequency. Square waves sound like aggressive, crunchy kick drums.
Triangular Wave
Triangular waves contain fundamentals plus the second power of odd harmonics. Because of the square of odd harmonics, they taper off as they get further away from fundamentals giving them a triangular shape.
It sounds somewhere in between a square wave and a sine wave. It’s not as buzzy as a square but not as smooth as a sine wave. It sounds clearer, maybe even brighter than a sine wave.
Sawtooth Wave
The sawtooth is the most extreme asymmetrical triangle wave. It can adopt two shapes: A progressively increasing ramp followed by an abrupt drop, or a sharp rise followed by a progressive descent.
When it comes to frequency, the sawtooth is the richest in terms of harmonics ─ it has them all! This richness makes it particularly interesting for subtractive synthesis.
It is the buzziest sounding of them all, sounding even harsher than a square wave, and that’s because it’s the richest in terms of harmonics.
This means it can be a really great choice for when you’re working with subtractive synthesis, which is when you construct a sound by filtering out frequencies, rather than adding them on.
How to Generate Audio Waveform Animations
There’s something about sound that has captured humanity’s attention for thousands of years. It’s one of the five kinds of input we receive to be able to interact with one another and the world around us. It’s pretty much our central mode of communication.
So it’s no surprise that some of the most creative minds in our community of humans are enthralled with being able to visually representing the audible. From music videos to fancy sculptures, what we hear is more and more often shown to us optically.
So much so, in fact, that nowadays it can be a long and winding road until you sign your first deal with a record label, which means that you need to fend for yourself until you make it big.
Audio Waveform Animation
Audio waveform visualizers combine the elements of art, graphic design, and technology to show viewers a representation of the sound they are listening to.
Creating music visualizers begins with software that has the ability to render in real-time. More intricate software programs require the user to execute scripts that accomplish two goals. These goals include extracting the data from the audio track that’s playing.

Audio Components for Music Visualizers
The first task is accomplished when the audio is loaded into the software program and played. That goes through an embedded node in the software program that analyzes the audio piece by piece.
Then it’s processed through an application programming interface (API) which normally is used to help build software through a communication between the client and the server. In this instance, it is synthesizing the audio along with other effects like filtering.
What Audio File Formats Are Supported?
When it comes to audio, the API can work with multiple audio file formats such as MP3, WAV, AAC, OGG, and others.
Furthermore, the API is compliant with all web browsers that one would use on their digital audio workstations. This process grabs all of the code for the next step.
Designing the Visuals
All of that data will then go through another executed script in the software program run by an API for the visualization process.
This API creates a line graph, which allows the user to add a load of vectors for the lines and to create scale factors to ensure all of the lines appear on the screen for the final visualization. Another embedded node will provide a range of decibels that this data will fall in.
The Final Product
Finally, the script initiates a function that loops through all of the collected data and sets one of the pre-allocated vectors up to create a loop to be rendered on the screen.
After this, the user can add extra features to their visualization such as color adjustments and brightness and even audience engagement such as having visitors pick different tracks to get new effects.
Of course, this all depends on the kind of software one would choose to use to create their music visualizers. All of these processes happen quietly behind the scenes so the user can focus on the mesmerizing visualization of their favorite music.
MotionBox Music Visualizer
Turn your music into a promotional snippet that you can share on social media. Add beautiful visualizers, waveforms, and audio spectrums online with Motionbox.
Effortlessly add these elements with the most intuitive online video editor in just a few clicks. This feature works perfectly for podcasters, musicians, voice actors, and more.
If you're looking to grow your audience through the power of social media, then this is your tool.

How to add a visualizer to your video?
Below are three simple steps on how you can add a visualizer.
1. Upload Audio
Upload your song audio. Once it's done uploading as soon as you select it to be added to the timeline. The UI will ask if you want to trim it. It's that simple.
2. Trim Audio
You might not want to give away the whole song. Trimming it is perfect to highlight an interesting segment and share it with the world. Then you can add text if you want to share where users can find it.
3. Add Visualizer
In the sidebar there are several premade visualizer options, pick the one you like. You can also add a video or a static image in the background. To spice it up access additional features like motion graphics.
Conclusion
So there you have, the basics of the audio waverform and how it can be used to create a music visualizer.
Audio is an extremely rich data source. Depending on the sample rate — the number of points sampled per second to quantify the signal — one second of data could contain thousands of points.
Scale this up to hours of recorded audio, and you can see how Machine Learning and Data Science nicely intertwine with signal processing techniques.
In the modern music industry, it’s imperative that you promote your brand and your work on all relevant platforms, and that includes platforms that are primarily geared towards visual content, such as YouTube.
If you want your music to stand out in the overcrowded YouTube scene, then you need to visualize your music with a modern music video maker that allows you to customize your videos and choose themes that fit into your brand perfectly but also resonate with your target audience.
Hey 👋 I am the founder and maker of Motionbox. My mission is to build useful tools in the video space. I enjoy science, art, and sports. Feel free to reach out to me.